If you want to monitor the health status of yuuvis® RAD including visualizations and notifications, the metrics-manager is your best choice. However, if you already have your own (company wide) monitoring system like Nagios or alike, then http API endpoints are probably more what you are looking for. This page describes for each component of yuuvis® RAD in detail which endpoints you can use and which information you get out of it.
Core-Service
There are two endpoint that can be used to check the health status of the core-service:
- http://<core-service-ip>:8080/rest-ws/#ENDPOINT:MonitorService.ping → http://<core-service-ip>:8080/rest-ws/service/monitor/ping
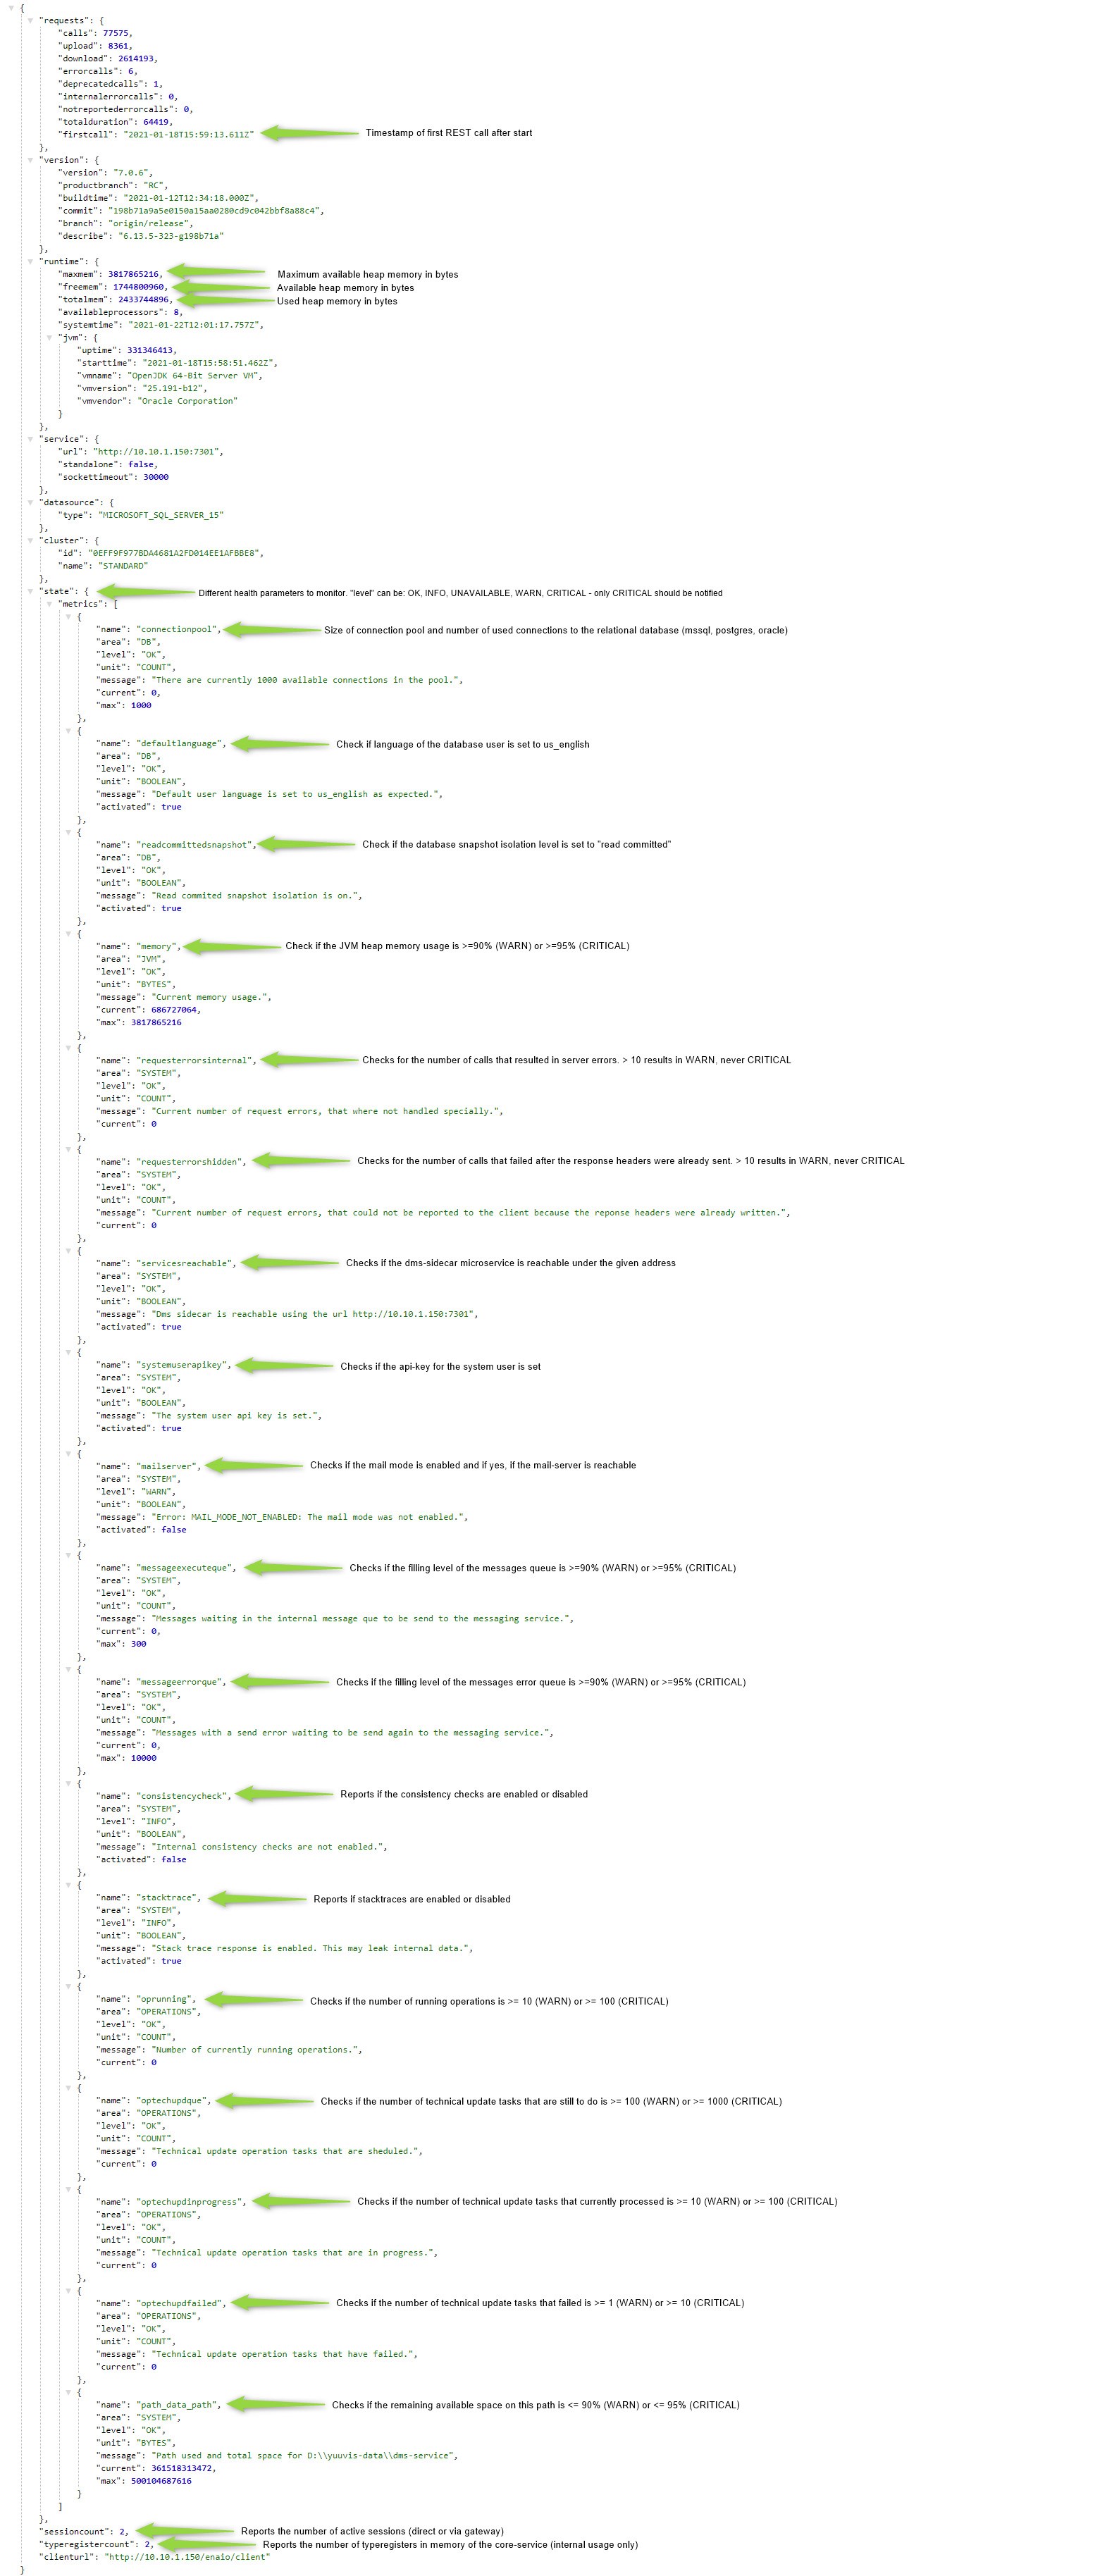
This endpoint can be called unauthenticated and will respond with a http response of 200 and the current system milliseconds timestamp as body if the core-service is up and running. Any other response or connection refusal means the core-service is not working correctly. - http://<core-service-ip>:8080/rest-ws/#ENDPOINT:MonitorService.getSummary → http://<core-service-ip>:8080/rest-ws/service/monitor?state=true
This endpoint can be called unauthenticated and will respond with a http response of 200 and a body with detailed information as described below. Any other http response or conncetion refusal means the core-service is not working correctly.
The body of the response looks like below (for example):
Calling this endpoint can become slower if you have very large content file storages (>= 30 Mio content files). We recommend using a polling interval of 1 minute or more to avoid performance impacts.
If a more frequent check is required, you can combine calling the ping endoint (in your desired frequency) for a simple availability check with calling this endpoint (once a minute or less).
Service-Manager
- TODO
Rendition-Plus
- TODO
