Health Monitoring with External Tools
If you want to monitor the health status of yuuvis® RAD including visualizations and notifications, yuuvis® metrics-manager is your best choice. However, if you already have your own (company wide) monitoring system like Nagios or alike, then http API endpoints are probably more what you are looking for. This page describes in detail for each component of yuuvis® RAD which endpoints you can use and which information you get out of it.
Core-Service
There are two endpoints that can be used to check the health status of the core-service:
- Ping: http://<core-service-ip>:8080/rest-ws/#ENDPOINT:MonitorService.ping → http://<core-service-ip>:8080/rest-ws/service/monitor/ping
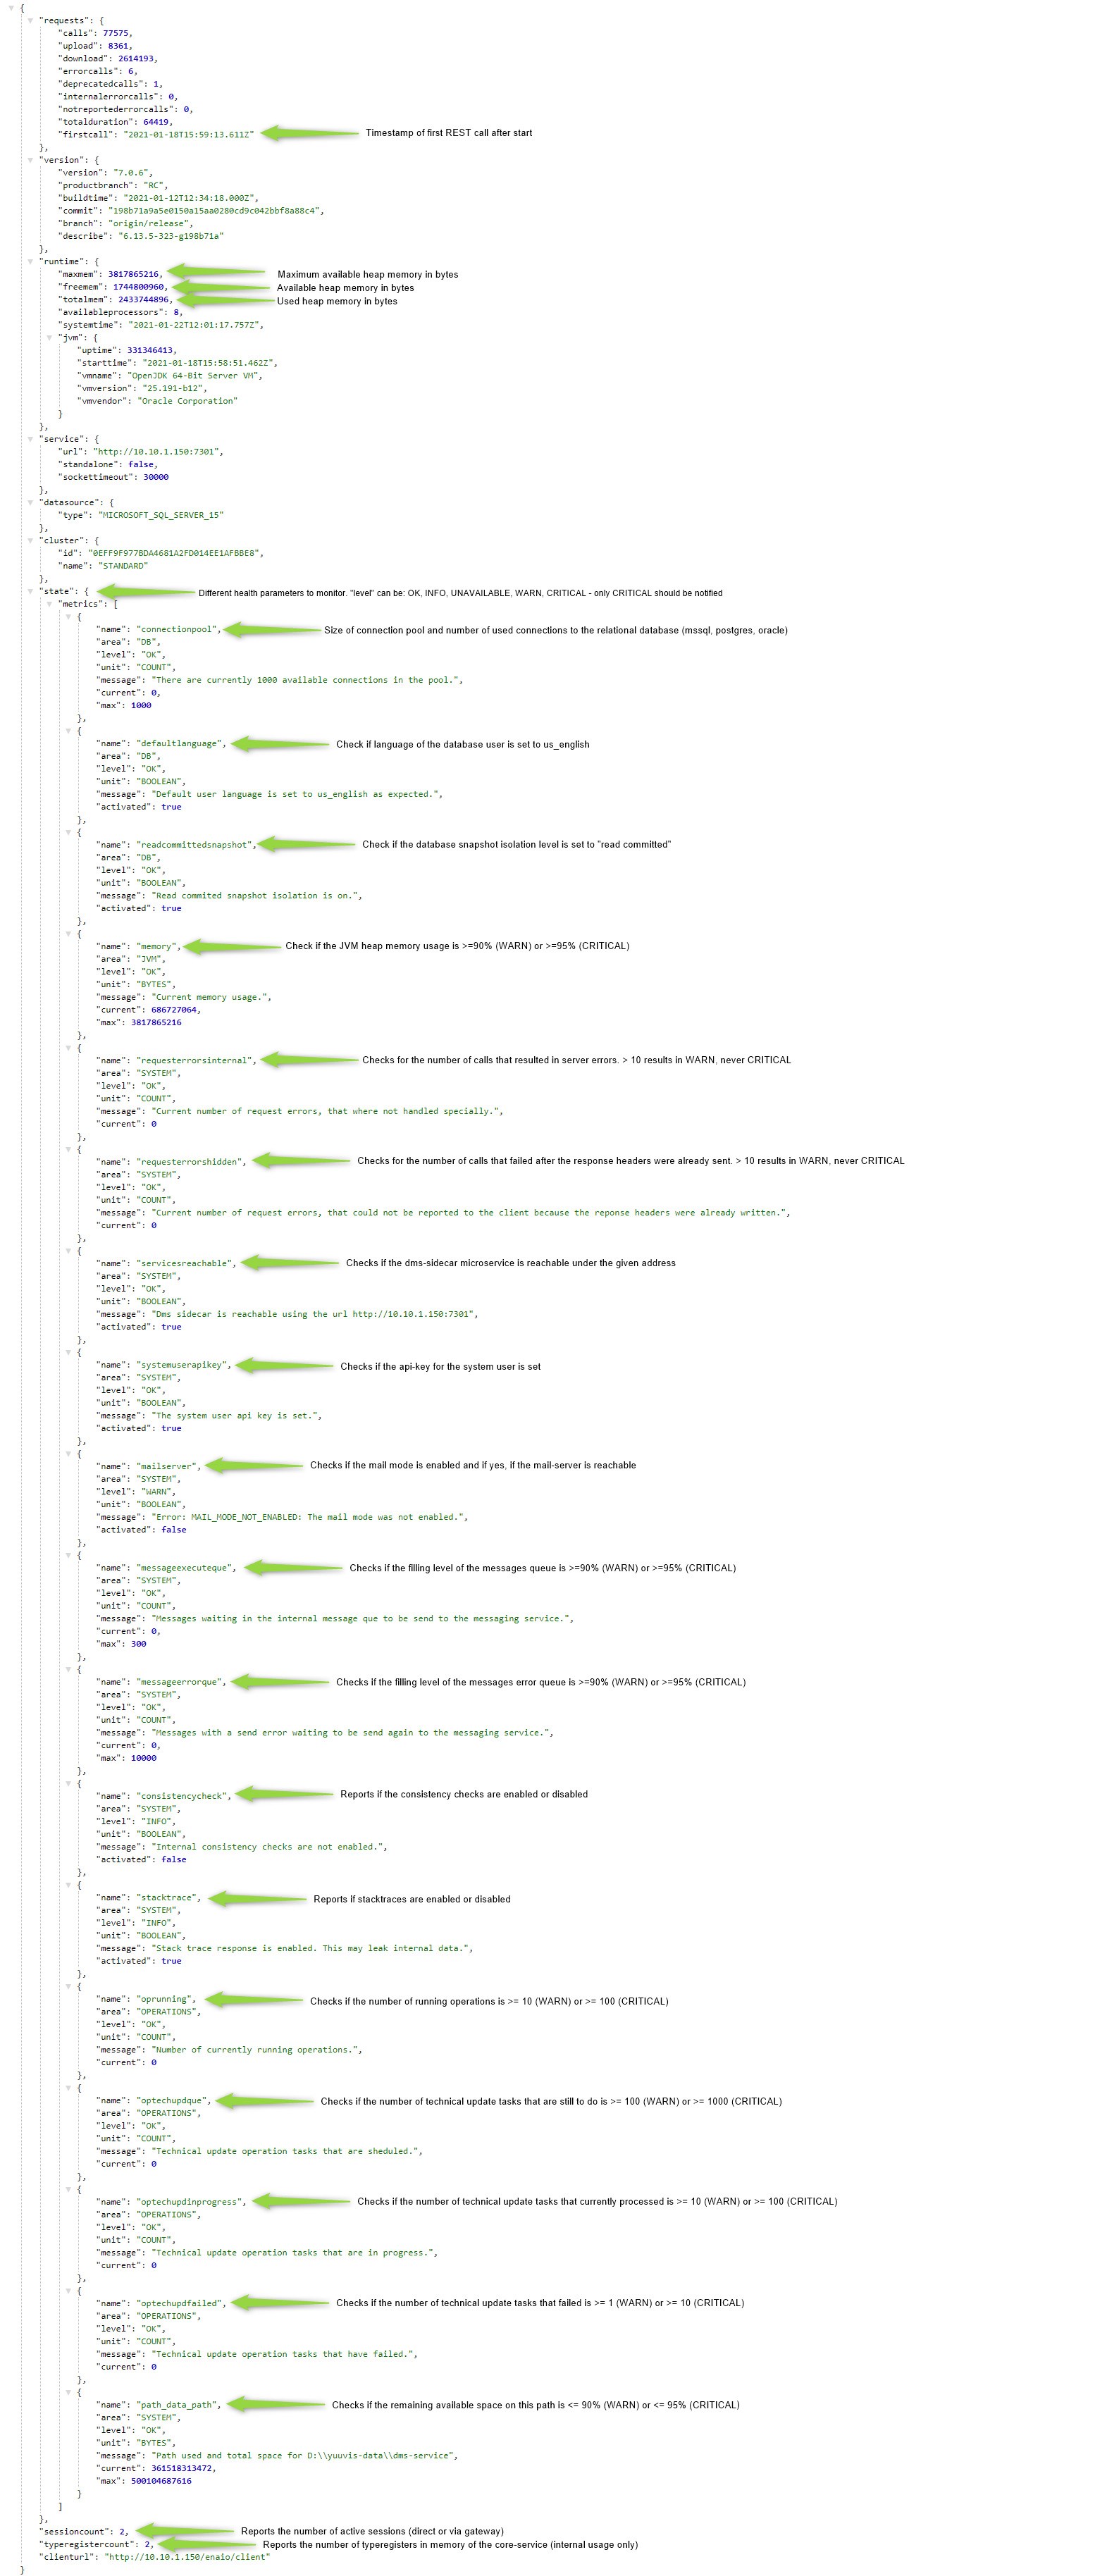
This endpoint can be called unauthenticated and will respond with an http response of 200 and the current system milliseconds timestamp as body if the core-service is up and running. Any other response or connection refusal means the core-service is not working correctly. - Summary: http://<core-service-ip>:8080/rest-ws/#ENDPOINT:MonitorService.getSummary → http://<core-service-ip>:8080/rest-ws/service/monitor?state=true
This endpoint can be called unauthenticated and will respond with an http response of 200 and a body with detailed information as described below. Any other http response or conncetion refusal means the core-service is not working correctly.
The body of the response looks like below (for example):
Calling this endpoint can become slower if you have very large content file storages (>= 30 Mio content files). We recommend using a polling interval of 1 minute or more to avoid performance impacts.
If a more frequent check is required, you can combine calling the ping endoint (in your desired frequency) for a simple availability check with calling this endpoint (once a minute or less).
If the core-service is DOWN the dms-sidecar microservice of the service-manager (see below) will be DOWN as well and vice versa.
Service-Manager
Querying each microservice individually
The Service-Manager consists of individual microservices that each offer a health check API endpoint. This can be queried by calling http://<service-manager-ip>:<microservice-instance-port>/manage/health.
As an example the (first) index-service instance will listen on port 7291 and thus its health can be checked by calling http://127.0.0.1:7291/manage/health and will return one of the following answers:
- http response 200 with body: {"status": "UP"} → this means the service itself an all dependencies are available and running correctly.
- http response 200 with body: {"status": "DOWN"} → this means either the service itself and/or one / multiple dependencies are not available or not working correctly.
- connection refused → service is not available → this means the service is either not started / crashed or it is not working correctly.
Attention: The structure microservice behaves differently and even reports status "UP" when one or more of its dependencies is "DOWN". The depencies are listed in the body and show which one is "UP" or "DOWN".
An overview of all possible microservices including their ports or port-ranges can be found here.
The admin-service applications endpoint
Alternatively the admin-microservice offers an API endpoint that aggregates all states: http://<service-manager-ip>:7273/applications
If the admin-service itself is up and running correctly the call returns an http response of 200 and a body like below.
Attention
Unfortunately in the currently used version of the admin-service there is a bug that prevents the admin-service from obtaining and thus returning correct states from some or all of the microservices. When this bug happens, the services.log log file will contain outputs from the admin service as follows:
adminservice.7273 : 2021-01-26 17:36:58.101 ERROR 8628 --- [freshExecutor-0] d.c.b.a.s.c.d.InstanceDiscoveryListener : Unexpected error.
adminservice.7273 : 2021-01-26 17:37:02.437 WARN 8628 --- [ parallel-4] d.c.b.a.s.services.StatusUpdateTrigger : Unexpected error while updating status for -1157797734:bpm:7321
adminservice.7273 : 2021-01-26 17:37:02.437 WARN 8628 --- [ parallel-4] d.c.b.a.s.services.StatusUpdateTrigger : Unexpected error while updating status for 825110274:inbox:7231
adminservice.7273 : 2021-01-26 17:37:09.124 ERROR 8628 --- [freshExecutor-0] d.c.b.a.s.c.d.InstanceDiscoveryListener : Unexpected error.
adminservice.7273 : 2021-01-26 17:37:11.796 WARN 8628 --- [ parallel-2] d.c.b.a.s.services.InfoUpdateTrigger : Unexpected error while updating info for -1157797734:bpm:7321
adminservice.7273 : 2021-01-26 17:37:11.796 WARN 8628 --- [ parallel-2] d.c.b.a.s.services.InfoUpdateTrigger : Unexpected error while updating info for 825110274:inbox:7231
In this case you can not rely on the returned states. The problem can be resolved by restarting the admin-service but it can happen again at any time.
For this reason this alternative might not be suitable for your needs. Please consider carefully.
Rendition-Plus
The health status of rendition-plus can be queried just like a microservice of the service-manager (see above) by using this URL: http://<rendition-plus-ip>:8090/osrenditioncache/app/management/health.
If rendition-plus is DOWN the microservice renditon-sidecar will also be DOWN and vice versa.
Elasticsearch
The health status of elasticsearch can be queried by calling this URL: http://<elasticsearch-ip>:9200/_cat/health
The endpoint requires authorization. If the connection is not refused (elaasticsearch is offline) and the authorization is correct, an http response of 200 and a body like below will be returned.
[
{
"epoch": "1611682123",
"timestamp": "17:28:43",
"cluster": "es-red",
"status": "green",
"node.total": "1",
"node.data": "1",
"shards": "11",
"pri": "11",
"relo": "0",
"init": "0",
"unassign": "0",
"pending_tasks": "0",
"max_task_wait_time": "-",
"active_shards_percent": "100.0%"
}
]
The values of "status" and "active_shards_percent" determine the health of elasticsearch.
- The "status" field can have the values "green", "yellow" and "red" that correspond to the meaning "Everything OK", "Warning(s)", "Error(s)" respectively. See https://www.elastic.co/guide/en/elasticsearch/reference/current/cluster-health.html for more information.
- If the value of the "active_shards_percent" field is at 100% this corresponds to a status of "green" and everything is ok. Any value less than 100% correspond to a "yellow" or "red" status and means that either a recovery is in progress or manual actions need to be taken. Also see https://www.elastic.co/guide/en/elasticsearch/reference/current/cat-health.html for more information.

